How Much Does Utilization Affect Credit Score
Credit utilization can account for roughly 20% to 30% of a credit score, and cutting a balance from 70% utilization to under 30% is usually where people see the fastest non-payment gains. That's why a score can drop even when every bill is paid on time, if one card suddenly reports a much higher balance than usual.
A common version of that moment looks ordinary. A fridge breaks, a flight gets booked, or a medical bill lands on a card, and the balance jumps from something manageable to something that looks scary on the statement. The score doesn't care that the purchase was necessary, it only sees how much of the available credit is now being used.
Table of Contents
- Why Utilization Deserves Your Attention
- What Utilization Actually Means in a Scoring Model
- How Utilization Tracks Across Score Bands
- What Different Utilization Ranges Do to Your Score
- Common Beliefs About Utilization That Mislead People
- Practical Ways to Bring Your Utilization Down
- Measuring the Score Impact Over 30 to 90 Days
- Putting It All Together and Choosing a Next Step
Why Utilization Deserves Your Attention
A consumer can pay every bill on time and still watch a score dip after a heavy spending month. The reason is credit utilization, the share of revolving credit that shows up as debt when the issuer reports the account. In plain terms, a card that's carrying a lot of its limit looks stressed, even if the balance is temporary and the spending was planned.
That's why utilization matters so much. In VantageScore 4.0, it's one of the two most important inputs, with 20% weight, and the model defines utilization as total outstanding balances divided by total credit limits, while Chase notes that VantageScore's scores were used 41.7 billion times in 2024, up from 26.9 billion in 2023 Chase on VantageScore 4.0. On the FICO side, Chase says FICO Score 8 gives amounts owed a 30% weight, while VantageScore 3.0 and 4.0 treat credit utilization as highly influential Chase on why VantageScore can be lower than FICO.
Practical rule: utilization is one of the few major score factors that can move quickly without waiting for years of new history.
A high reported balance can make someone look more dependent on credit than they really are. That's why the question isn't just whether utilization matters, it's how much it matters when the reported balance changes. The answer depends on the ratio, the rest of the profile, and whether the card was already near a scoring pressure point.
What Utilization Actually Means in a Scoring Model
The math is simple. Utilization equals total reported revolving balances divided by total revolving credit limits. If a card has a $10,000 limit and reports a $3,000 balance, utilization is 30% on that card. If the same person has several cards, the score can also care about the combined ratio across all revolving accounts.
A simple way to think about it
A fuel gauge works better than credit jargon. A nearly full tank suggests the driver has room left, while a nearly empty tank says the vehicle is close to maxed out. Credit scoring models read high utilization the same way, as a sign that available borrowing room is getting tight.
The reporting date matters just as much as the spending. Card issuers usually send the balance that exists around the statement closing date, not every payment made during the month, so the number that gets reported can be higher than the number the cardholder thinks of as “current.” That's why a person can pay in full after the statement closes and still be scored on the earlier, higher balance for that cycle.
Useful shortcut: add the balances on revolving accounts, add the limits, then divide the first total by the second. Installment loans, like mortgages and auto loans, don't belong in this calculation.
VantageScore also makes utilization a moving target because the ratio can change from day to day, and its newer model looks at trended utilization instead of only one snapshot VantageScore consumer guide. That's why timing can matter as much as the amount itself. The score is reacting to what the bureaus received, not just to what was paid before the due date.
How Utilization Tracks Across Score Bands
Experian's published credit data shows a steady pattern. Average card utilization drops as scores improve, from 80.7% for poor scores to 61.4% for fair, 38.6% for good, 15.2% for very good, and 7.1% for exceptional Experian credit utilization rate data. The numbers do not promise a specific score band, but they do show how strongly reported balances and credit score strength tend to move together.
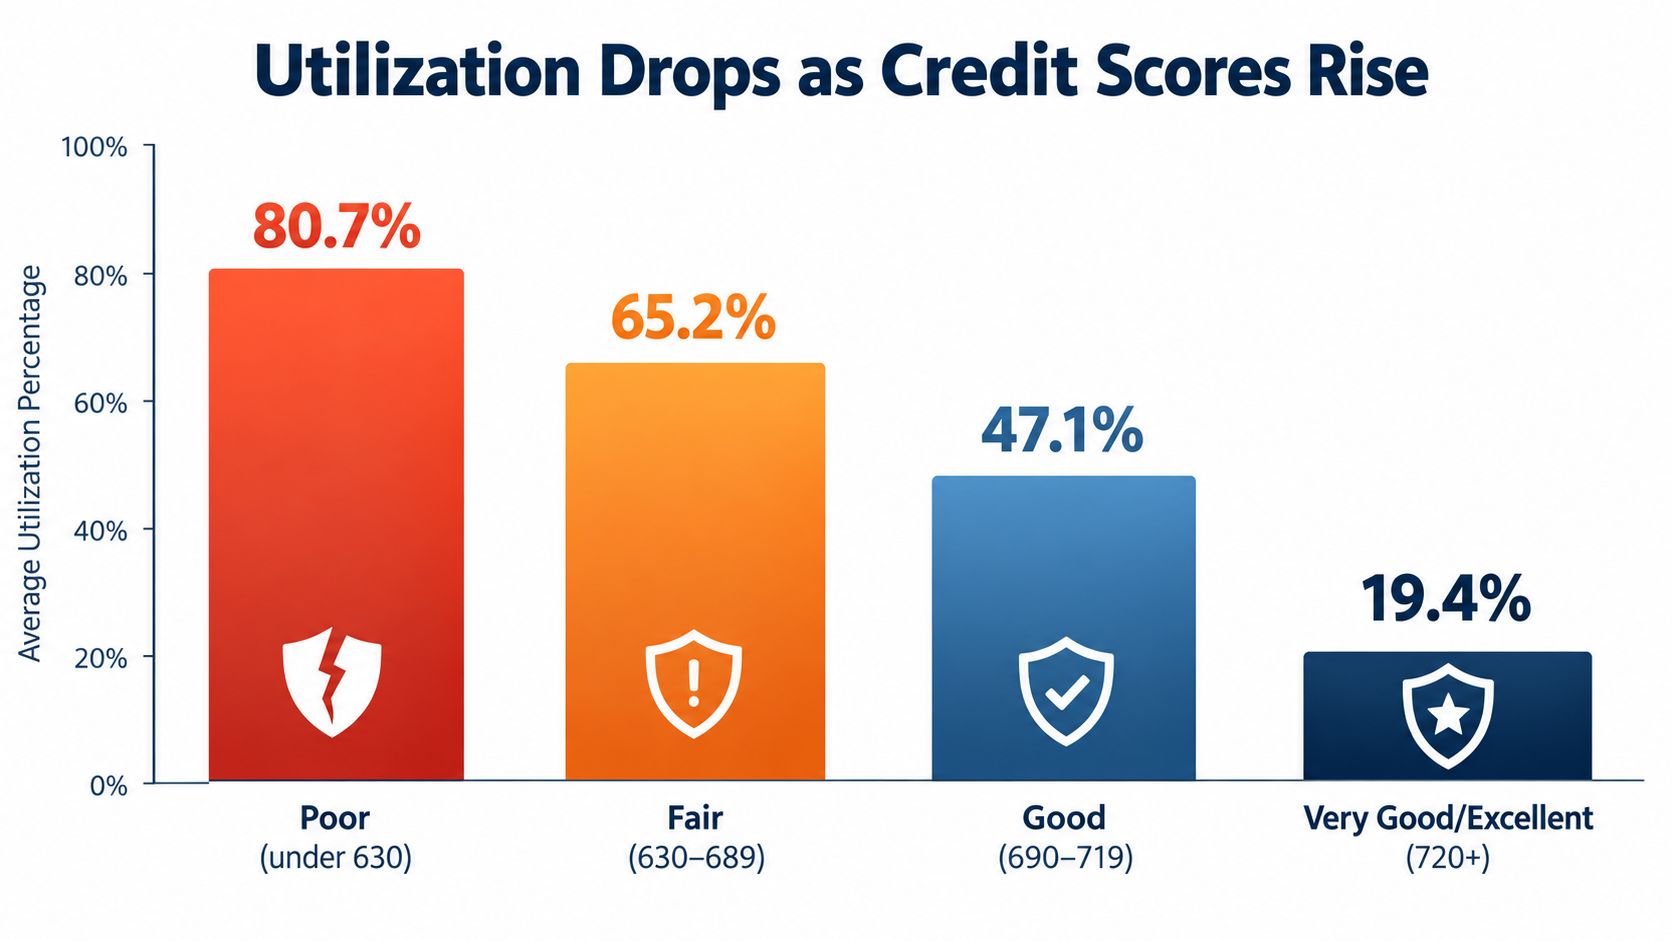
Read the pattern as a set of checkpoints. Higher utilization usually signals tighter borrowing room, while lower utilization suggests more space between the balance and the limit. Other pieces still shape the score, payment history, account age, recent applications, and derogatory marks can all push the result in different directions.
The dollar example makes the shift easier to see. With $20,000 in total limits, 80.7% utilization means about $16,140 reported, 30% means $6,000, and 7.1% means $1,420. Scores improve when reported balances shrink relative to limits, and the same payment can matter more or less depending on where the card starts.
A card at 80.7% carries a very different signal from one at 7.1%. The first leaves little breathing room, while the second shows plenty. That is why utilization works like a sliding scale, where every step down usually helps, even if the size of the lift changes along the way.
What Different Utilization Ranges Do to Your Score
With utilization, the curve matters more than the cliff. A lower balance usually helps, but the size of the change tends to be larger when a card moves out of a high-pressure zone and smaller when it's already near the low end. That's why a drop from a maxed-out look to a modest balance can feel dramatic, while a drop from already low utilization may move the score less.
| Utilization Ratio | Balance on $5,000 Limit | Approximate Score Impact |
|---|---|---|
| 90% | $4,500 | Often strong pressure on the score because the card looks heavily used |
| 50% | $2,500 | Still elevated, usually better than maxed out but not yet in a comfort zone |
| 30% | $1,500 | Common soft target, where pressure often starts easing |
| 10% | $500 | Much stronger profile signal, especially when reported across multiple cards |
| 1% | $50 | Near-single-digit utilization, where many strong profiles live |
A card at 90% utilization is sending a very different message from a card at 30%. The first looks crowded, the second looks manageable. The same payment can produce different reactions too, because paying $500 off a card that's close to maxed out can change the ratio more visibly than paying $500 on a card that's already near 1%.
The “30% rule” is best understood as a pressure point, not a wall. Scores can still improve above it and below it, but the area around that level is where the model usually starts reacting more sharply. That's also why moving from the low 30s to the mid 20s can matter more than people expect, especially when the rest of the file is thin or a single card holds most of the revolving debt.
Common Beliefs About Utilization That Mislead People
The biggest myth is that 30% is a hard cutoff. It isn't. Scores don't flip from good to bad at one exact percentage, and they don't automatically reward every ratio below 30% equally. A lower ratio is better, but the benefit follows a curve.
A second mistake is closing an old card to “fix” utilization. That usually backfires, because the total available credit shrinks and the remaining balances now represent a larger share of a smaller limit pool. The account closure can also hurt the age mix of the file, which means the repair can create a new problem.
The third misunderstanding is about payment timing. Paying the statement balance in full helps only if the lower balance is what gets reported. If the payment lands after the statement closes, the bureaus may still receive the higher number for that cycle.
Model-aligned truth: utilization responds to both balance size and reporting date, so the best move is often to pay before the statement closes, not just before the due date.
That timing issue is why the next step should focus on the reporting cycle, not only on the monthly bill. The score doesn't track intentions, it tracks the balance that was sent. A low reported balance can help immediately, even if the account was briefly higher earlier in the month.
Practical Ways to Bring Your Utilization Down
The fastest fixes usually happen inside one billing cycle. Paying a card before the statement closes can lower the balance that gets reported, and a targeted extra payment after a large purchase can keep a temporary spike from showing up on the bureau file. If the goal is a lower score reading this month, timing matters as much as the amount paid.
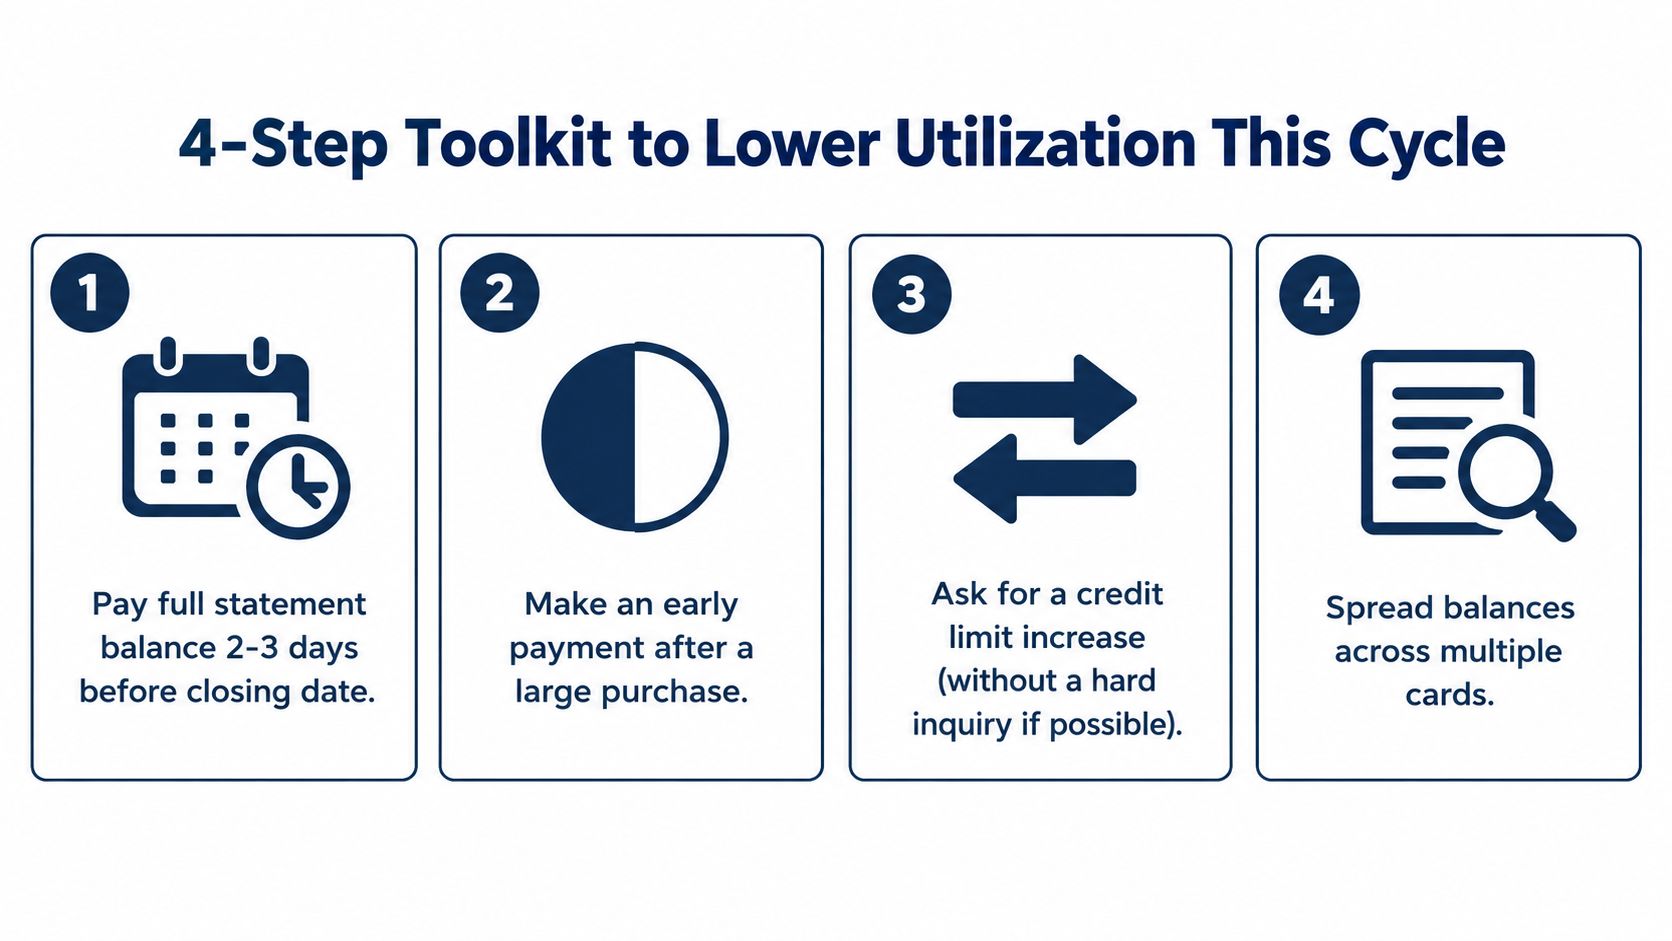
Four moves that can lower the ratio now
- Pay before the statement closes. A payment that lands 2 to 3 days before the closing date can help the issuer report a lower balance.
- Make an early payment after a large purchase. This keeps one card from showing a sudden spike even if the spending was temporary.
- Ask for a credit limit increase. If the issuer approves it without a hard inquiry, the same balance becomes a smaller percentage of the limit.
- Spread balances across multiple cards. Keeping one card from looking overloaded can help both the card-level and overall ratios.
A simple planning tool can help with the arithmetic of payoff order and balance timing, especially when multiple cards are involved, and a debt payoff calculator like Debt Help U's payoff planner can help map which balance to target first. The key idea isn't to chase zero on every card, it's to keep reported utilization from clustering high on one account.
A higher limit can help, but only if spending doesn't rise with it. A bigger limit with the same balance lowers utilization immediately, while a bigger limit paired with more spending leaves the ratio unchanged. That's why the cleanest gains usually come from lowering the reported balance first.
Measuring the Score Impact Over 30 to 90 Days
A score change from utilization rarely shows up as one giant leap and then nothing. It's more useful to watch it over 30, 60, and 90 days, because the first reported change often arrives after the next statement cycle and later cycles confirm whether the new pattern is stable. A baseline screenshot on day one makes it easier to tell whether the score is reacting to utilization or to something else.
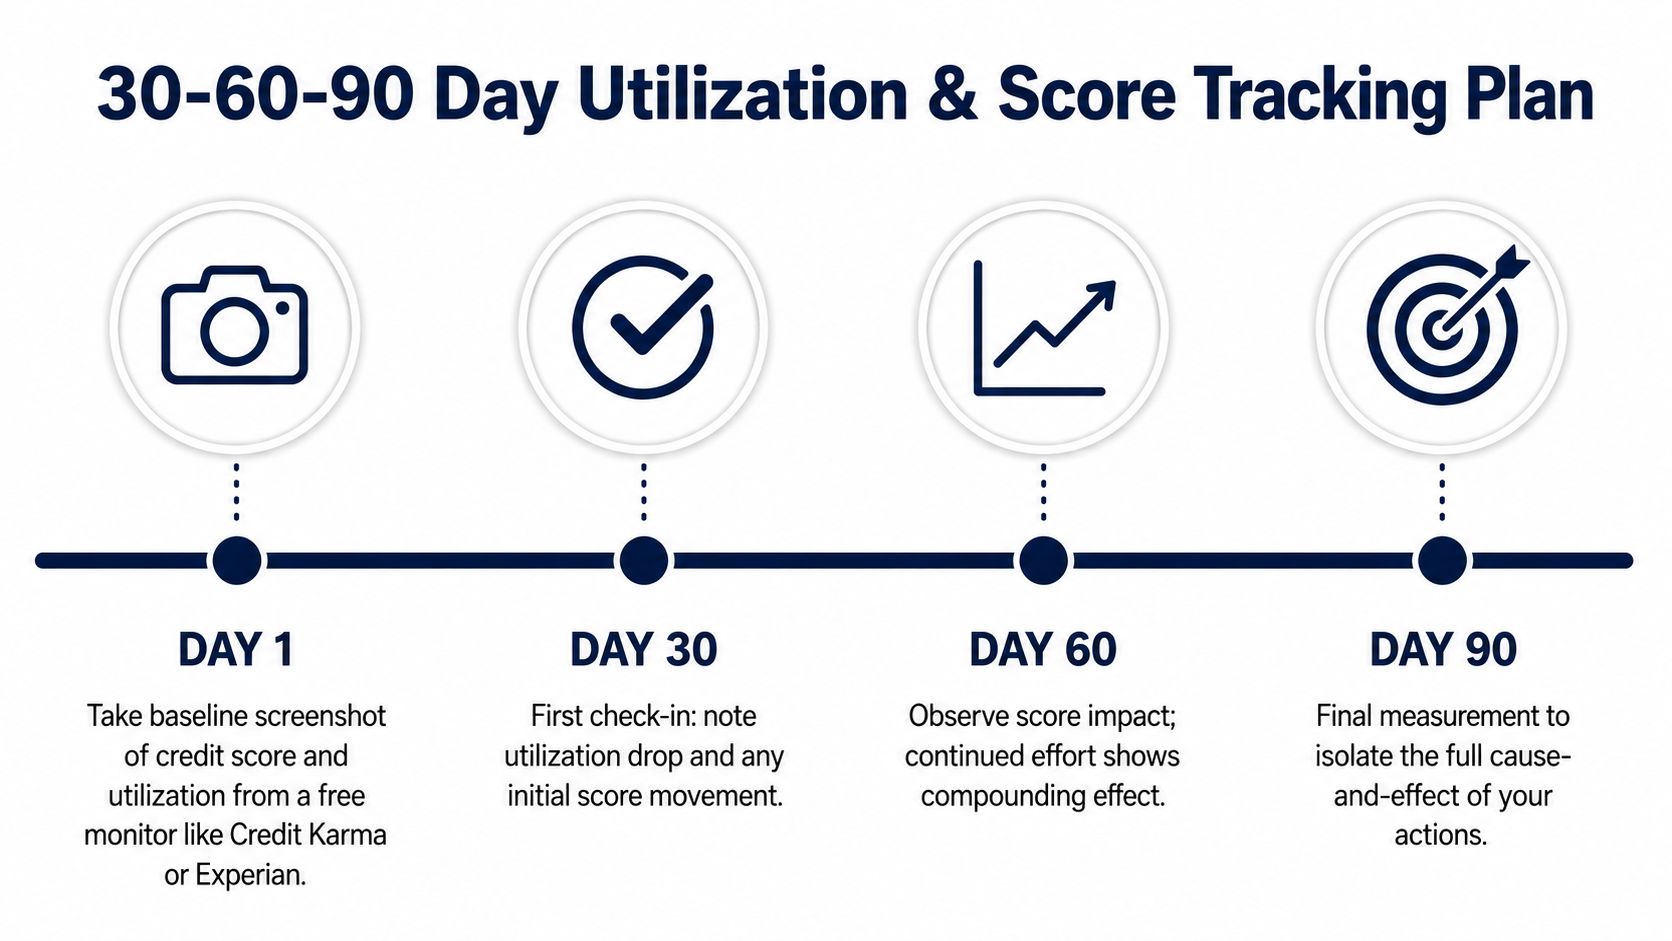
A simple tracking routine
- Day 1. Save the current score and note each card's reported balance.
- Day 30. Check whether the lower balance was reported and whether the score moved.
- Day 60. Compare the same cards again, looking for a repeatable pattern.
- Day 90. Review whether the lower utilization is now the new normal.
A free monitor that shows score and balance trends can make this easier, and a minimum-payment planner such as Debt Help U's minimum payment calculator can help separate the effect of extra payments from the effect of time. Real-world movement varies, but a drop from high utilization into a safer range can produce noticeable gains, while a move from already low utilization to even lower may produce a smaller change.
Other events can overwhelm the benefit. A missed payment, a new mortgage inquiry, or an account closure can pull the score in another direction while utilization is improving. The cleanest read comes when the file stays otherwise steady for a few cycles.
Putting It All Together and Choosing a Next Step
Utilization is one of the fastest-acting pieces of a credit file, and it sits near the top of the scoring stack because both FICO and VantageScore treat it as a major input Chase on VantageScore and FICO weights. The important part is that it behaves like a continuous variable, not a light switch. Scores can improve below 30%, stay under pressure just above it, and become stronger still as balances move into single digits.
That matters for the person who watched a score fall after a high-balance month. The problem usually wasn't the purchase itself, it was the balance that got reported. If the same card had been paid down before the statement closed, the score could have seen a different number for that cycle.
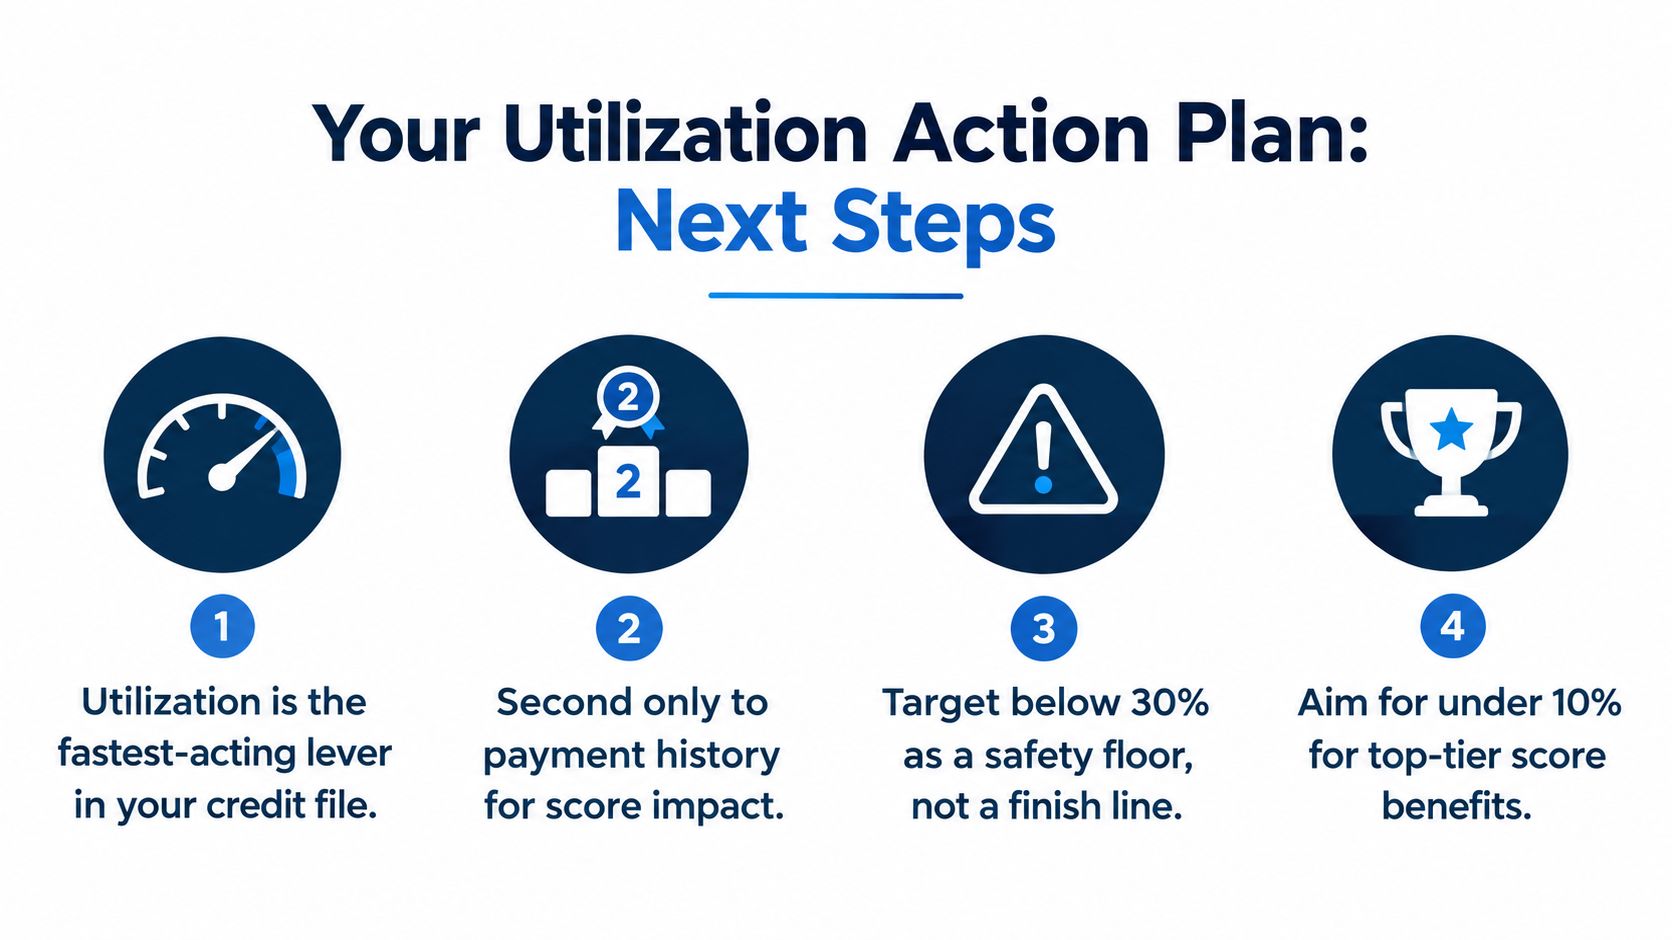
The next step is straightforward. Pull the latest statement, calculate each card's reported balance against its limit, and schedule the payment so the lowest possible balance lands before the closing date. A guide like Debt Help U's debt payoff timeline resource can help turn that number into a plan that's easier to follow week by week.
Debt Help U offers free calculators and plain-language guides that help consumers see how balances, payoff timing, and repayment choices affect their debt picture. For anyone trying to lower utilization and understand which balance to attack first, Debt Help U is a practical place to compare options and build a smarter payment plan.
Related guides
- How long will it take to pay off my credit card debt? Your minimum payment shrinks every month. Following it down is what turns a five-year balance into a thirty-five-year one.
- How to get out of credit card debt without a loan Borrowing your way out is the advice everyone gives first. Here is what works when you do not want more debt.
- Debt settlement vs. consolidation vs. bankruptcy Four paths out of unmanageable debt, what each one costs, and what each one breaks. Real numbers on a $30,000 balance, not a pitch for any of them.